News - These are the 3 main Ethereum on-chain indicators
By
These are the 3 main Ethereum on-chain indicators
On-chain indicators are becoming increasingly important to the price of Ethereum. The three most important ones under the microscope.
For crypto analysts, on-chain metrics have become indispensable for understanding the fundamental economics and potential of various blockchain networks such as Ethereum. As the largest and oldest smart contract platform in the crypto market, Ethereum offers a wide range of on-chain data that provides insight into the state of the network.
Below we look at three of the currently most important Ethereum on-chain indicators and analyze what they can tell us about the state and future of the ecosystem. How high is the network's revenue? What is Ethereum's inflation rate? And how much ETH is currently tied up in smart contracts?
1. Ethereum earnings and impact on ETH price.
Ethereum's revenue can be compared to the revenue of a real company like Meta, but with one key difference: while Meta generates revenue through advertisements and services, Ethereum's revenue comes primarily from fees charged for transactions and the use of smart contracts on the platform. These fees are a price users are willing to pay to use the services of the Ethereum network - similar to how customers pay for products or services from companies like Meta.
Since 2015, Ethereum has collected an impressive $16.8 billion in fees. According to Caleb en Brown Research more than 60 percent of these fees are seen directly as revenue for the network. This shows how valuable the network is.
But why are these revenues important to the ETH price? Quite simply, high revenues show that the network is being actively used. And that attracts more users and investors. When revenues rise, investors in Meta and Co. also gain confidence. The result: the stock price rises. So in Ethereum, increasing revenue can have a positive impact on the ETH price.
By observing revenues on Ethereum, one can get a feel for the growth of the network. Similarly, analysts study Meta's earnings to estimate its future potential. Similarly with Ethereum: by analyzing revenues, one can better understand the potential future price movements of ETH. In terms of total revenue over the past seven years, Ethereum is in the same league as Meta, Microsoft, Shopify and others over the same period.
2. Ethereum inflation: the drivers and recent developments
Another interesting metric that can be derived from Ethereum's blockchain data is the ETH inflation rate. Ethereum's inflation rate is somewhat similar to how a central bank puts new money into circulation - but with a twist. While central banks can control the money supply to promote economic stability, new Ether is created at a fixed rate via staking. This is similar to a company issuing new shares to generate capital. Ethereum, on the other hand, issues new ETH (currently about 3.2 percent of total ETH per year) to reward stakers for securing the network.
However, with the introduction of the EIP-1559 upgrade in August 2021, another variable comes into play that affects Ethereum's annual inflation rate. This is because some of the transaction fees have since been "burned," or more simply, destroyed. This has a similar effect on the ETH rate as buying back a company's shares. This is because the burn mechanism programmed into the EIP-1559 causes a certain portion of each ETH transaction to destroy a certain amount of Ether used for that transaction.
The effect of this continuous "burning" of ETH is that the total amount of ETH decreases and - if this happens in sufficient quantities - can put deflationary pressure on Ethereum's inflation rate.
This deflationary pressure may in turn have a positive effect on the price of ETH as fewer new coins are created while some existing coins are burned. If demand for Ether stays the same or increases, this could result in rising prices.
Overall, Ethereum's burn rate is a fascinating indicator that tells us a lot about the health and potential of the network. Similarly, the level of share buybacks in companies can give us an idea of its health and future prospects.
What about the current inflation of the ETH network?
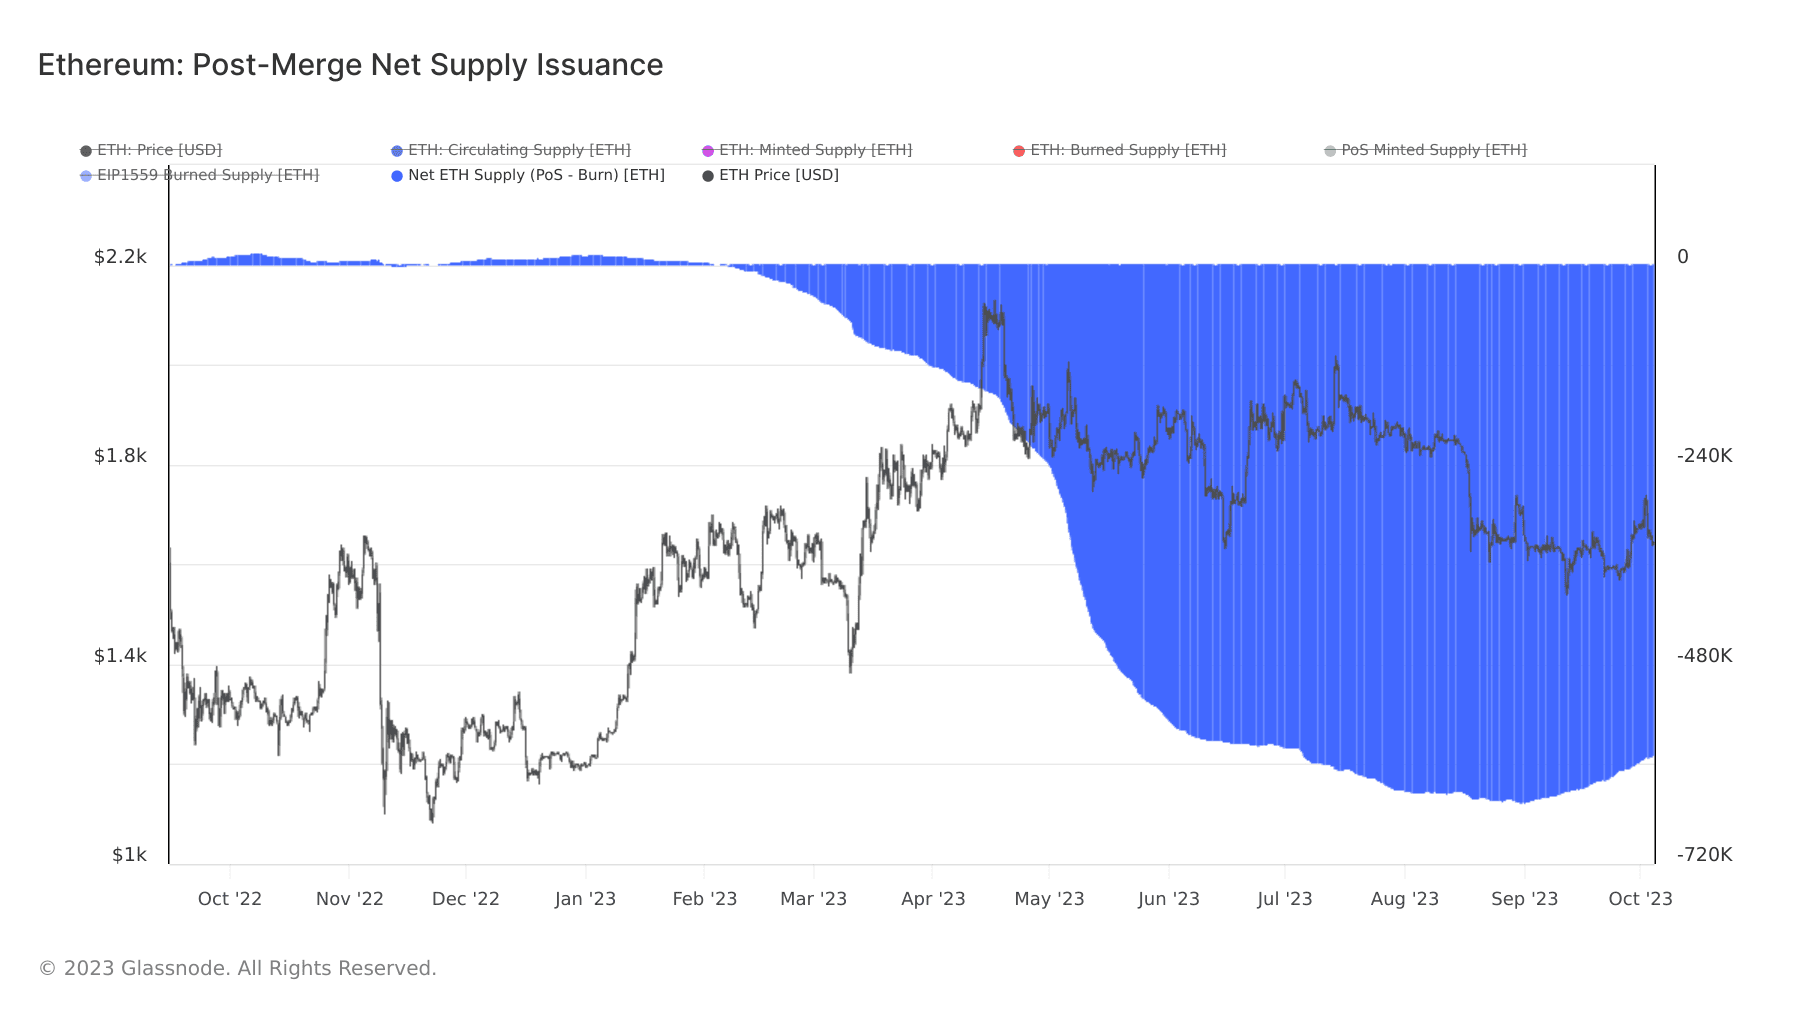
Looking at Ethereum's current inflation rate, we can see from the following graphic from Glassnode infer that the ETH network has been deflationary since 'The Merge'.
Bron: Glassnode
The combustion mechanism thus exceeded the amount of Ether newly paid out to stakers. This reduced the total amount of ETH available by about 600,000 Ether. In recent months, however, inflation is again showing a slight upward trend. This suggests that activity on the Ethereum main chain is currently declining and that the burn mechanism no longer exerts enough deflationary pressure to offset the new ETH paid out to stakers.
3. Number of Ethereum locked into smart contracts.
Unlike Bitcoin, which functions primarily as a store of value, Ethereum provides the basis for an ecosystem of decentralized applications (dApps). For example, applications of Decentralised Finance (DeFi), Staking or Non-fungible Tokens (NFTs). Many of these dApps require ETH to be locked into smart contracts, temporarily removing these quantities from the open market.
Therefore, the amount of ETH included in smart contracts can have a significant impact on the ETH price. A higher share of ETH trapped in smart contracts can increase the price if demand remains the same, because less ETH is available for trading. Conversely, a lower share of ETH trapped in smart contracts can lower the price because there will be more ETH available in the market. As with the inflation rate, this means an increase in the Ether price if demand stays the same or increases.
Moreover, the amount of ETH in smart contracts indirectly reflects the usefulness of the network and users' trust in it. On the one hand, the fact that more users are willing to deposit ETH into smart contracts shows that the network is being used. Moreover, it indicates that investors trust the network because they are willing to put their Ether into smart contracts.
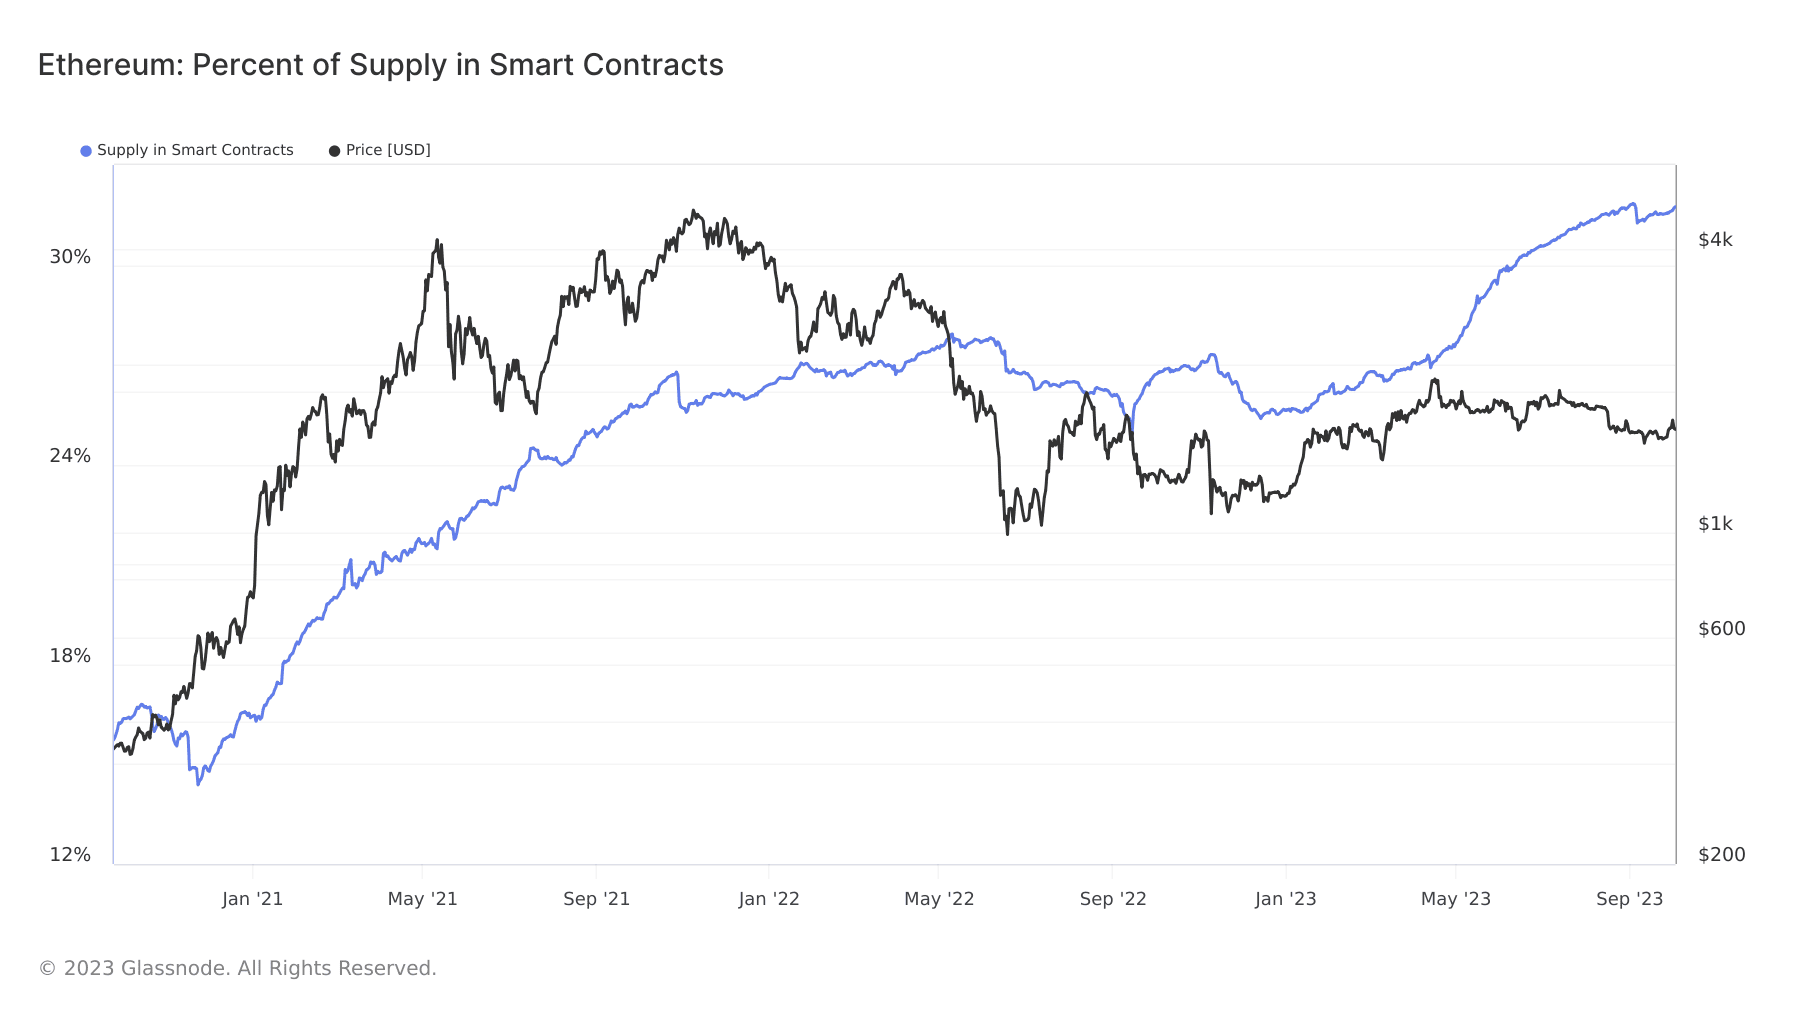
This is how much Ethereum is currently in smart contracts
Currently sitting according to Glassnode about 32 percent of all ETH in smart contracts (DeFi, NFTs, Staking ...). Over time, one can also see that the amount of ETH in smart contracts has grown steadily in recent years, indicating that the network is in a healthy state.
Bron: Glassnode
Thus, the amount of ETH in smart contracts is an important on-chain indicator. It underscores that for Ethereum, compared to Bitcoin, it is not enough just to look at the stock of ETH on centralized crypto exchanges. While this metric is often a good indicator of market sentiment and analysis of potential trends for Bitcoin, for Ethereum it only gives part of the picture. In contrast, the amount of ETH in smart contracts provides insight into the true scarcity of ETH, network activity and user confidence in the Ethereum blockchain. Understanding the dynamics of ETH in smart contracts is therefore essential for a holistic picture.


